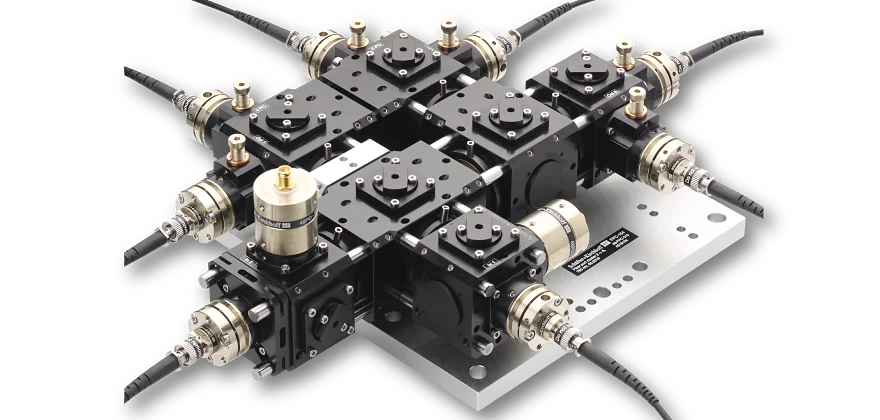
Thermal Stability Test of the Fiber Port Cluster 1-6
This Whitepaper reports on the output power and polarization stability of a fiber port cluster (FPC) with one input port and six output ports at a wavelength of 561 nm. The cluster is exposed to a temperature range from 20°C to 30°C in a climate chamber. In addition, a thermal stress test is performed by applying rapidly changing of thermal conditions between 10°C and 35°C.
All of the output ports have a stability of more than 90% of their maximum output power over the entire temperature range. This results in a power imbalance of less than ±2.5% for each output port pair.
The polarization extinction ratio (PER) is found to be well above 21 dB for all output ports and temperatures. In addition, the thermal stress test shows robust operation even under rapidly changing thermal conditions with no permanent drifts.
Thermal stress test
In order to measure the robustness of the fiber port cluster to rapidly changing thermal environment a thermal stress test is performed. Therefore, a second cycle with faster temperature variations is applied. Here, the chamber temperature is cycled between 10 °C and 35 °C with a cycle time of approximately 130 minutes. This corresponds to a maximum temperature change rate of 0.5 °C/min, which inhibits thermalization and leads to various temperature gradients within the cluster.

Pairwise output power balance.

Pairwise output power balance. The ratio of the output power pair P3 / P4 are shown in dependence of the applied chamber temperature. The maximum deviation in the output power for all output pairs is well below ± 8% for the entire stress test.

Pairwise output power balance. The ratio of the output power pair P5 / P6 are shown in dependence of the applied chamber temperature. The maximum deviation in the output power for all output pairs is well below ± 8% for the entire stress test.